Grundlæggende statistik
| Institutionelle ejere | 166 total, 165 long only, 0 short only, 1 long/short - change of -0,89% MRQ |
| Gennemsnitlig porteføljeallokering | 0.0690 % - change of -20,55% MRQ |
| Institutionelle aktier (lange) | 51.030.304 (ex 13D/G) - change of -2,53MM shares -8,18% MRQ |
| Institutionel værdi (lang) | $ 277.803 USD ($1000) |
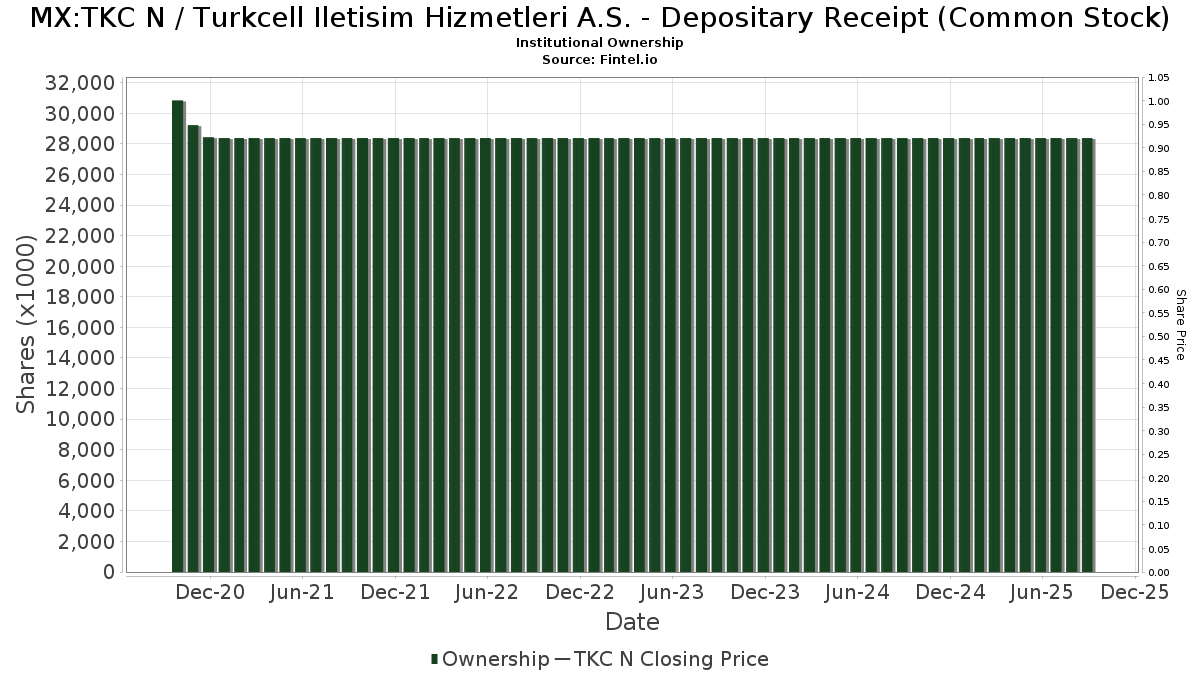
Institutionelt ejerskab og aktionærer
Turkcell Iletisim Hizmetleri A.S. - Depositary Receipt (Common Stock) (MX:TKC N) har 166 institutionelle ejere og aktionærer, der har indsendt 13D/G- eller 13F-formularer til Securities Exchange Commission (SEC). Disse institutioner har i alt 51,030,304 aktier. Største aktionærer omfatter Morgan Stanley, BlackRock, Inc., Delaware Management Holdings, Inc., Millennium Management Llc, Goldman Sachs Group Inc, Two Sigma Investments, Lp, Arrowstreet Capital, Limited Partnership, American Century Companies Inc, Point72 Asset Management, L.P., and Renaissance Technologies Llc .
Turkcell Iletisim Hizmetleri A.S. - Depositary Receipt (Common Stock) (BMV:TKC N) institutionel ejerskabsstruktur viser aktuelle positioner i virksomheden efter institutioner og fonde, samt seneste ændringer i positionsstørrelse. Større aktionærer kan omfatte individuelle investorer, investeringsforeninger, hedgefonde eller institutioner. Skema 13D angiver, at investoren besidder (eller besidder) mere end 5 % af virksomheden og har til hensigt (eller har til hensigt at) aktivt at forfølge en ændring i forretningsstrategi. Skema 13G indikerer en passiv investering på over 5%.
Fondens stemningsscore
Fund Sentiment Score (fka Ownership Accumulation Score) finder de aktier, der bliver mest købt af fonde. Det er resultatet af en sofistikeret, multi-faktor kvantitativ model, der identificerer virksomheder med de højeste niveauer af institutionel akkumulering. Scoringsmodellen bruger en kombination af den samlede stigning i oplyste ejere, ændringerne i porteføljeallokeringer i disse ejere og andre målinger. Tallet går fra 0 til 100, hvor højere tal indikerer et højere niveau af akkumulering for sine jævnaldrende, og 50 er gennemsnittet.
Opdateringsfrekvens: Dagligt
Se Ownership Explorer, som giver en liste over højest rangerende virksomheder.
AI+ Ask Fintel’s AI assistant about Turkcell Iletisim Hizmetleri A.S. - Depositary Receipt (Common Stock).
Select a question to share a public post with an AI-crafted answer.
Thinking of good questions…
13F og NPORT arkivering
Detaljer om 13F-arkivering er gratis. Detaljer om NP-ansøgninger kræver et premium-medlemskab. Grønne rækker angiver nye positioner. Røde rækker angiver lukkede positioner. Klik på linket ikon for at se den fulde transaktionshistorik.
Opgrader
for at låse premium-data op og eksportere til Excel ![]() .
.
| Fil dato | Kilde | Investor | Type | Gennemsnitlig pris (Øst) |
Aktier | Δ Aktier (%) |
Rapporteret Værdi ($1000) |
Δ Værdi (%) |
Port Alloc (%) |
|
|---|---|---|---|---|---|---|---|---|---|---|
| 2026-02-13 | 13F | Macquarie Group Ltd | 0 | -100,00 | 0 | |||||
| 2026-02-06 | 13F | IFP Advisors, Inc | 120 | 0,00 | 1 | |||||
| 2026-02-17 | 13F | Aquatic Capital Management LLC | 99.493 | 544 | ||||||
| 2026-02-17 | 13F | United Capital Financial Advisers, Llc | 16.161 | 6,60 | 88 | -3,30 | ||||
| 2026-02-10 | 13F | Sivia Capital Partners, LLC | 14.219 | 4,82 | 78 | -4,94 | ||||
| 2026-02-05 | 13F | Abacus Wealth Partners, LLC | 49.428 | 270 | ||||||
| 2026-02-04 | 13F | D'Orazio & Associates, Inc. | 10.887 | 1,19 | 60 | -7,81 | ||||
| 2026-02-11 | 13F | Vise Technologies, Inc. | 500.894 | 0,12 | 2.740 | -9,03 | ||||
| 2026-01-23 | 13F | Assetmark, Inc | 174 | -8,42 | 1 | -100,00 | ||||
| 2026-01-28 | 13F | HB Wealth Management, LLC | 12.773 | 16,73 | 70 | 6,15 | ||||
| 2026-01-22 | 13F | Maseco Llp | 276 | 2 | ||||||
| 2026-02-11 | 13F | O'shaughnessy Asset Management, Llc | 679.707 | 4,29 | 3.718 | -5,25 | ||||
| 2026-02-17 | 13F | Royal Bank Of Canada | 10.834 | 47,97 | 60 | 33,33 | ||||
| 2026-02-17 | 13F | Two Sigma Investments, Lp | 2.177.337 | 10,70 | 11.910 | 0,59 | ||||
| 2026-01-30 | 13F | R Squared Ltd | 0 | -100,00 | 0 | |||||
| 2026-02-17 | 13F | Advisor Group Holdings, Inc. | 511 | -56,10 | 3 | -66,67 | ||||
| 2026-01-26 | 13F | PDS Planning, Inc | 41.755 | 11,67 | 228 | 1,33 | ||||
| 2026-01-26 | 13F | Cwm, Llc | 11.994 | -8,79 | 0 | |||||
| 2026-02-17 | 13F | Balyasny Asset Management Llc | 0 | -100,00 | 0 | |||||
| 2026-02-17 | 13F | Trexquant Investment LP | 418.156 | 38,39 | 2.287 | 25,73 | ||||
| 2025-11-13 | 13F | Glenmede Investment Management, LP | 11.797 | 0,31 | 71 | 0,00 | ||||
| 2026-02-17 | 13F | Public Employees Retirement System Of Ohio | 0 | -100,00 | 0 | |||||
| 2026-02-11 | 13F | Simplex Trading, Llc | 0 | -100,00 | 0 | |||||
| 2026-02-11 | 13F | Simplex Trading, Llc | Put | 0 | -100,00 | 0 | ||||
| 2026-02-17 | 13F | Point72 Asset Management, L.P. | 1.399.240 | 140,34 | 7.654 | 118,41 | ||||
| 2026-02-11 | 13F | Simplex Trading, Llc | Call | 0 | -100,00 | 0 | ||||
| 2026-02-13 | 13F | Verition Fund Management LLC | 109.704 | 600 | ||||||
| 2026-02-06 | 13F | Global Retirement Partners, LLC | 1.345 | 221,00 | 7 | 250,00 | ||||
| 2026-02-12 | 13F | CIBC Private Wealth Group, LLC | 7.850 | 0,00 | 43 | -10,64 | ||||
| 2026-02-09 | 13F | Harbour Investments, Inc. | 234 | 0,00 | 1 | 0,00 | ||||
| 2026-02-10 | 13F | Greenspring Advisors, LLC | 11.537 | 63 | ||||||
| 2026-01-20 | 13F | Signaturefd, Llc | 43.684 | -1,33 | 239 | -10,53 | ||||
| 2026-02-17 | 13F | Quadrature Capital Ltd | 108.183 | -74,09 | 592 | -76,46 | ||||
| 2026-02-10 | 13F | Connor, Clark & Lunn Investment Management Ltd. | 65.961 | 37,77 | 361 | 25,00 | ||||
| 2026-02-13 | 13F | JustInvest LLC | 149.543 | 6,20 | 818 | -3,42 | ||||
| 2026-02-13 | 13F | Inspire Advisors, LLC | 22.720 | 2,95 | 124 | -6,06 | ||||
| 2026-02-06 | 13F | HighTower Advisors, LLC | 11.895 | 65 | ||||||
| 2026-02-14 | 13F | Rockefeller Capital Management L.P. | 47 | -96,06 | 0 | -100,00 | ||||
| 2026-01-05 | 13F | GAMMA Investing LLC | 14.642 | 58,53 | 80 | 45,45 | ||||
| 2026-02-11 | 13F | Jpmorgan Chase & Co | 167.995 | -4,94 | 919 | -13,64 | ||||
| 2026-02-11 | 13F | CLARET ASSET MANAGEMENT Corp | 22.480 | -18,20 | 0 | |||||
| 2026-02-13 | 13F | State Street Corp | 1.026.095 | 34,25 | 5.705 | 23,97 | ||||
| 2026-01-22 | 13F | Financial Consulate, Inc | 90 | 0 | ||||||
| 2026-02-13 | 13F | MAI Capital Management | 1.977 | 82,21 | 11 | 66,67 | ||||
| 2026-02-13 | 13F | Ieq Capital, Llc | 56.165 | 25,02 | 307 | 13,70 | ||||
| 2026-02-11 | 13F | Parallel Advisors, LLC | 37.658 | -20,12 | 206 | -27,56 | ||||
| 2026-01-16 | 13F | RHS Financial, LLC | 19.170 | -11,80 | 105 | -20,00 | ||||
| 2026-01-14 | 13F | Jfs Wealth Advisors, Llc | 925 | 0,00 | 5 | 0,00 | ||||
| 2026-02-17 | 13F | CWM Advisors, LLC | 13.230 | 16,83 | 72 | 5,88 | ||||
| 2026-02-17 | 13F | Guggenheim Capital Llc | 186.083 | 11,70 | 1.018 | 1,50 | ||||
| 2026-02-12 | 13F | Bank Of Montreal /can/ | 21.107 | 115 | ||||||
| 2025-10-30 | 13F | Twin Peaks Wealth Advisors, LLC | 0 | -100,00 | 0 | |||||
| 2026-02-13 | 13F | Citigroup Inc | 351.424 | 0,94 | 1.922 | -8,26 | ||||
| 2026-02-11 | 13F | Cerity Partners LLC | 174.586 | -4,22 | 955 | -13,04 | ||||
| 2026-02-06 | 13F | Lsv Asset Management | 102.400 | 0,00 | 1 | |||||
| 2026-01-29 | 13F | Verdence Capital Advisors LLC | 11.413 | 3,28 | 62 | -6,06 | ||||
| 2026-01-29 | 13F | Warren Street Wealth Advisors, LLC | 16.820 | 5,15 | 92 | -4,17 | ||||
| 2026-02-12 | 13F | BlackRock, Inc. | 5.091.103 | 15,15 | 27.848 | 4,63 | ||||
| 2025-11-14 | 13F | Cubist Systematic Strategies, LLC | 306.699 | 248,40 | 1.846 | 246,99 | ||||
| 2026-01-28 | 13F | CAPROCK Group, Inc. | 77.157 | -2,44 | 430 | -7,53 | ||||
| 2026-02-10 | 13F | Bnp Paribas Arbitrage, Sa | 880.604 | 4,90 | 4.817 | -4,69 | ||||
| 2026-02-17 | 13F | Delaware Management Holdings, Inc. | 4.686.553 | 25.635 | ||||||
| 2026-02-13 | 13F | Discerene Group LP | 199.788 | 0,00 | 1.093 | -9,15 | ||||
| 2026-01-13 | 13F | Kathmere Capital Management, LLC | 25.554 | 15,36 | 140 | 4,51 | ||||
| 2026-02-11 | 13F | Winton Capital Group Ltd | 22.500 | 123 | ||||||
| 2026-02-12 | 13F | Brown Brothers Harriman & Co | 586 | 74,40 | 3 | 50,00 | ||||
| 2026-02-19 | 13F/A | Axxcess Wealth Management, Llc | 14.365 | 0,00 | 79 | -9,30 | ||||
| 2026-01-20 | 13F | AdvisorNet Financial, Inc | 52 | 0,00 | 0 | |||||
| 2026-02-12 | 13F | Hrt Financial Lp | 47.454 | -56,55 | 0 | |||||
| 2026-02-13 | 13F | Rhumbline Advisers | 71.871 | -0,79 | 393 | -9,86 | ||||
| 2026-02-12 | 13F | JBF Capital, Inc. | 15.000 | 0,00 | 82 | -8,89 | ||||
| 2026-02-03 | 13F | Manning & Napier Advisors Llc | 0 | -100,00 | 0 | |||||
| 2026-01-30 | 13F | Valued Wealth Advisors LLC | 689 | 0,00 | 4 | -25,00 | ||||
| 2026-02-03 | 13F | SBI Securities Co., Ltd. | 5.097 | 49,96 | 28 | 35,00 | ||||
| 2026-02-17 | 13F | Two Sigma Advisers, Lp | 599.200 | 52,08 | 3.278 | 38,21 | ||||
| 2026-02-12 | 13F | Renaissance Technologies Llc | 1.280.600 | 182,58 | 7.005 | 156,74 | ||||
| 2026-02-06 | 13F | EverSource Wealth Advisors, LLC | 20.541 | 1,42 | 112 | -7,44 | ||||
| 2026-02-13 | 13F | Wells Fargo & Company/mn | 275 | -15,38 | 2 | 0,00 | ||||
| 2026-02-05 | 13F | Bessemer Group Inc | 45.062 | 0,72 | 0 | |||||
| 2026-02-10 | 13F/A | Northwestern Mutual Wealth Management Co | 40 | 0 | ||||||
| 2026-02-13 | 13F | Squarepoint Ops LLC | 11.601 | 63 | ||||||
| 2026-02-12 | 13F | Dimensional Fund Advisors Lp | 81.539 | 103,83 | 446 | 85,83 | ||||
| 2026-02-10 | 13F | Acadian Asset Management Llc | 13.251 | -82,74 | 0 | |||||
| 2026-01-08 | 13F | True Wealth Design, LLC | 218 | 74,40 | 1 | |||||
| 2026-02-13 | 13F | Atlas Capital Advisors Llc | 0 | -100,00 | 0 | |||||
| 2026-03-26 | 13F | Leonteq Securities AG | 0 | -100,00 | 0 | |||||
| 2026-02-11 | 13F | West Family Investments, Inc. | 46.471 | 5,40 | 254 | -4,15 | ||||
| 2025-11-12 | 13F | Integrated Quantitative Investments LLC | 0 | -100,00 | 0 | |||||
| 2026-02-03 | 13F | Mitsubishi UFJ Kokusai Asset Management Co., Ltd. | 35.043 | 28,63 | 196 | 18,90 | ||||
| 2026-02-17 | 13F | Mercer Global Advisors Inc /adv | 11.007 | -22,65 | 60 | -29,41 | ||||
| 2026-02-12 | 13F | Jane Street Group, Llc | 111.513 | 610 | ||||||
| 2026-02-17 | 13F | Northern Trust Corp | 361.792 | 30,99 | 1.979 | 19,07 | ||||
| 2026-02-11 | 13F | Fox Run Management, L.l.c. | 0 | -100,00 | 0 | |||||
| 2026-02-12 | 13F | Skopos Labs, Inc. | 40.048 | 140,31 | 223 | 123,00 | ||||
| 2025-11-06 | 13F | Wealthstream Advisors, Inc. | 10.781 | 65 | ||||||
| 2025-11-07 | 13F | Sierra Ocean, Llc | 0 | -100,00 | 0 | |||||
| 2026-02-03 | 13F | Ballentine Partners, LLC | 62.330 | -13,79 | 341 | -21,84 | ||||
| 2026-02-13 | 13F | Morgan Stanley | 11.219.091 | -0,96 | 61.368 | -10,01 | ||||
| 2026-02-13 | 13F | Smartleaf Asset Management LLC | 2.746 | 0,00 | 15 | -6,25 | ||||
| 2026-02-17 | 13F | SageView Advisory Group, LLC | 172 | 1 | ||||||
| 2026-01-27 | 13F | TD Waterhouse Canada Inc. | 4.000 | 0,00 | 22 | -12,50 | ||||
| 2026-02-17 | 13F | Quantinno Capital Management LP | 49.199 | -1,53 | 269 | -10,33 | ||||
| 2026-02-05 | 13F | Allworth Financial LP | 2.369 | -2,91 | 13 | -14,29 | ||||
| 2026-02-03 | 13F | Navigoe, LLC | 156 | 0,00 | 0 | |||||
| 2026-02-13 | 13F | SRS Capital Advisors, Inc. | 7.493 | 381,25 | 41 | 344,44 | ||||
| 2026-02-13 | 13F | American Century Companies Inc | 1.424.409 | 13,57 | 7.792 | 3,19 | ||||
| 2026-01-30 | 13F | Us Bancorp \de\ | 38.856 | -10,06 | 213 | -18,46 | ||||
| 2026-02-13 | 13F | Marshall Wace, Llp | 161.692 | -89,14 | 884 | -90,13 | ||||
| 2026-02-17 | 13F | Virtus Investment Advisers, Inc. | 27.842 | 152 | ||||||
| 2026-02-09 | 13F | Legal & General Group Plc | 10.317 | 0,00 | 56 | -9,68 | ||||
| 2026-02-13 | 13F | Parkside Financial Bank & Trust | 398 | 0,00 | 2 | 0,00 | ||||
| 2026-02-17 | 13F | Two Sigma Securities, Llc | 21.635 | -72,43 | 118 | -75,00 | ||||
| 2026-02-12 | 13F | Principal Securities, Inc. | 0 | -100,00 | 0 | |||||
| 2026-02-13 | 13F | PCM Encore, LLC | 17.143 | 94 | ||||||
| 2026-02-17 | 13F | Tower Research Capital LLC (TRC) | 0 | -100,00 | 0 | |||||
| 2025-11-12 | 13F | NewSquare Capital LLC | 0 | -100,00 | 0 | |||||
| 2026-01-27 | 13F | WealthCollab, LLC | 6.002 | 59,71 | 33 | 45,45 | ||||
| 2026-03-06 | 13F | Hsbc Holdings Plc | 0 | -100,00 | 0 | |||||
| 2025-11-12 | 13F | Aprio Wealth Management, LLC | 0 | -100,00 | 0 | -100,00 | ||||
| 2026-02-24 | 13F | DGS Capital Management, LLC | 123.617 | 10,41 | 676 | 0,30 | ||||
| 2026-02-13 | 13F | Pathstone Holdings, LLC | 91.417 | 6,39 | 501 | -3,29 | ||||
| 2026-02-03 | 13F | Sageworth Trust Co | 0 | -100,00 | 0 | |||||
| 2026-02-13 | 13F | Pinnacle Wealth Planning Services, Inc. | 12.515 | 1,30 | 68 | -8,11 | ||||
| 2026-02-13 | 13F | Centiva Capital, LP | 65.315 | -49,95 | 357 | -54,52 | ||||
| 2026-01-12 | 13F | Abound Wealth Management | 78 | 0,00 | 0 | |||||
| 2026-02-17 | 13F | Glenmede Trust Co Na | 12.097 | 2,35 | 66 | -9,59 | ||||
| 2026-01-30 | 13F | North Star Investment Management Corp. | 282 | 224,14 | 2 | |||||
| 2026-03-03 | 13F/A | Caitong International Asset Management Co., Ltd | 227 | 1 | ||||||
| 2026-02-13 | 13F | Mariner, LLC | 98.991 | 24,97 | 543 | 13,87 | ||||
| 2026-02-17 | 13F | Jump Financial, LLC | 109.263 | -45,98 | 598 | -50,94 | ||||
| 2025-11-14 | 13F | Wetherby Asset Management Inc | 79.611 | -9,79 | 479 | -10,13 | ||||
| 2026-01-16 | 13F | Ronald Blue Trust, Inc. | 41.364 | 73,12 | 226 | 58,04 | ||||
| 2026-02-17 | 13F | Cetera Investment Advisers | 11.367 | 0,15 | 62 | -8,82 | ||||
| 2026-02-03 | 13F | Sequoia Financial Advisors, LLC | 124.458 | 33,09 | 681 | 21,00 | ||||
| 2026-02-13 | 13F | Ubs Asset Management Americas Inc | 1.952 | 11 | ||||||
| 2026-02-19 | 13F | CI Private Wealth, LLC | 123.562 | 7,16 | 676 | -2,59 | ||||
| 2025-10-14 | 13F | Foster Group, Inc. | 0 | -100,00 | 0 | -100,00 | ||||
| 2026-02-02 | 13F | Qrg Capital Management, Inc. | 21.771 | 53,67 | 119 | 40,00 | ||||
| 2026-02-13 | 13F | Y-Intercept (Hong Kong) Ltd | 280.835 | 1.536 | ||||||
| 2026-01-16 | 13F | Empirical Financial Services, LLC d.b.a. Empirical Wealth Management | 10.239 | 56 | ||||||
| 2026-02-17 | 13F | Discovery Capital Management, Llc / Ct | 0 | -100,00 | 0 | |||||
| 2026-01-29 | 13F | UMA Financial Services, Inc. | 408 | -38,28 | 2 | -33,33 | ||||
| 2026-02-09 | 13F | Hantz Financial Services, Inc. | 19.468 | 35,05 | 0 | |||||
| 2026-01-29 | 13F | UBS Group AG | 745.889 | 230,46 | 4.080 | 200,44 | ||||
| 2026-02-17 | 13F | Modern Wealth Management, LLC | 34.580 | -16,91 | 189 | -24,40 | ||||
| 2026-02-05 | 13F | Gabelli Funds Llc | 405.500 | 0,00 | 2.218 | -9,14 | ||||
| 2026-02-13 | 13F | Stifel Financial Corp | 225.091 | 1,20 | 1.231 | -8,00 | ||||
| 2025-11-14 | 13F | Raymond James Financial Inc | 0 | -100,00 | 0 | |||||
| 2026-02-03 | 13F | Ethic Inc. | 62.964 | -10,51 | 344 | -18,68 | ||||
| 2026-02-11 | 13F | Group One Trading, L.p. | Put | 500 | -83,87 | 3 | -88,89 | |||
| 2026-01-21 | 13F | Yousif Capital Management, Llc | 15.522 | 0,00 | 95 | 2,15 | ||||
| 2026-02-11 | 13F | Group One Trading, L.p. | 1.406 | 370,23 | 8 | 600,00 | ||||
| 2026-02-11 | 13F | Group One Trading, L.p. | Call | 900 | -55,00 | 5 | -66,67 | |||
| 2026-01-15 | 13F | Frank, Rimerman Advisors LLC | 97.525 | 533 | ||||||
| 2026-01-27 | 13F | Evergreen Capital Management Llc | 18.319 | -27,28 | 102 | -32,45 | ||||
| 2026-02-17 | 13F | Voloridge Investment Management, Llc | 527.939 | 2.888 | ||||||
| 2026-01-20 | 13F | Ascent Group, LLC | 17.213 | 1,41 | 94 | -7,84 | ||||
| 2026-01-23 | 13F | Farther Finance Advisors, LLC | 8.603 | 197,78 | 47 | 176,47 | ||||
| 2026-02-13 | 13F | Sei Investments Co | 11.740 | 64 | ||||||
| 2026-02-19 | 13F | Atomi Financial Group, Inc. | 30.214 | 4,60 | 165 | -4,62 | ||||
| 2026-02-12 | 13F | Barometer Capital Management Inc. | 0 | -100,00 | 0 | |||||
| 2026-01-26 | 13F | KBC Group NV | 35.111 | 0,00 | 0 | |||||
| 2026-02-17 | 13F | Millennium Management Llc | 3.329.078 | -4,76 | 18.210 | -13,46 | ||||
| 2026-01-23 | 13F | Ritholtz Wealth Management | 316.710 | -3,82 | 1.732 | -12,61 | ||||
| 2026-02-17 | 13F | Qube Research & Technologies Ltd | 515.126 | 569,67 | 2.818 | 508,42 | ||||
| 2026-02-24 | 13F | Bell Investment Advisors, Inc | 717 | 0,00 | 4 | -25,00 | ||||
| 2026-01-08 | 13F | Tuttle Tactical Management LLC | 18.465 | 101 | ||||||
| 2026-02-13 | 13F | Cornerstone Financial Management LLC | 100 | 1 | ||||||
| 2025-10-20 | 13F | HighMark Wealth Management LLC | 0 | -100,00 | 0 | |||||
| 2026-02-17 | 13F | Creative Planning | 697.644 | 75,96 | 3.816 | 59,93 | ||||
| 2026-02-17 | 13F | Bank Of America Corp /de/ | 213.227 | 302,28 | 1.166 | 265,52 | ||||
| 2026-02-17 | 13F | Citadel Advisors Llc | 1.110.271 | 1.186,02 | 6.073 | 1.070,13 | ||||
| 2026-02-17 | 13F | Ameriprise Financial Inc | 0 | -100,00 | 0 | |||||
| 2026-02-12 | 13F | Campbell & CO Investment Adviser LLC | 70.390 | 385 | ||||||
| 2026-02-13 | 13F | Arrowstreet Capital, Limited Partnership | 1.529.827 | 45,24 | 8.368 | 31,97 | ||||
| 2026-01-23 | 13F | Westside Investment Management, Inc. | 1.214 | 0,00 | 7 | -14,29 | ||||
| 2026-02-12 | 13F | Triumph Capital Management | 0 | -100,00 | 0 | |||||
| 2026-02-06 | 13F | Larson Financial Group LLC | 161 | 1 | ||||||
| 2026-02-17 | 13F | Laird Norton Trust Company, Llc | 149.397 | 833 | ||||||
| 2025-11-14 | 13F | Virtu Financial LLC | 0 | -100,00 | 0 | |||||
| 2026-02-17 | 13F | XTX Topco Ltd | 188.441 | -14,29 | 1.031 | -22,15 | ||||
| 2026-02-11 | 13F | IMA Wealth, Inc. | 15 | 0 | ||||||
| 2025-11-07 | 13F | Syon Capital Llc | 0 | -100,00 | 0 | |||||
| 2026-02-11 | 13F | Erste Asset Management GmbH | 8.000 | 44 | ||||||
| 2026-02-17 | 13F | Fmr Llc | 58.077 | -25,67 | 318 | -32,55 | ||||
| 2026-02-17 | 13F | PharVision Advisers, LLC | 18.484 | 101 | ||||||
| 2026-01-15 | 13F | Nisa Investment Advisors, Llc | 204 | 1 | ||||||
| 2026-02-04 | 13F | Argos Wealth Advisors, LLC | 13.011 | 71 | ||||||
| 2026-02-06 | 13F | Pnc Financial Services Group, Inc. | 115.095 | 1,68 | 630 | -7,64 | ||||
| 2026-02-18 | 13F | Vident Advisory, LLC | 243.812 | 1,64 | 1.334 | -7,69 | ||||
| 2026-02-04 | 13F | Colonial River Wealth Management, LLC | 14.365 | 0,00 | 79 | -9,30 | ||||
| 2026-02-10 | 13F | Goldman Sachs Group Inc | 2.973.174 | 12,89 | 16.263 | 2,57 | ||||
| 2026-02-13 | 13F | Barclays Plc | 0 | -100,00 | 0 | |||||
| 2026-02-12 | 13F | Quadrant Capital Group Llc | 241.446 | 151,48 | 1.321 | 128,94 | ||||
| 2026-02-10 | 13F | Savant Capital, LLC | 14.270 | 5,31 | 78 | -3,70 | ||||
| 2026-02-17 | 13F | Graham Capital Management, L.P. | 76.453 | 418 | ||||||
| 2026-02-13 | 13F | First Trust Advisors Lp | 32.134 | 10,54 | 176 | 0,57 | ||||
| 2026-02-17 | 13F | Aqr Capital Management Llc | 231.920 | -10,58 | 1.266 | -18,16 |